先写下遇到的问题及解决
导入pandas_datareader时出错
import pandas_datareader
出现
...
ImportError: cannot import name 'is_list_like'
根据stackoverflow的提问,通过评论中通过
import pandas as pd
pd.core.common.is_list_like = pd.api.types.is_list_like
来解决报错
获取阿里巴巴股票数据出错
alibaba = pdr.get_data_yahoo('BABA')
出现
ImmediateDeprecationError: Yahoo Actions has been immediately
deprecated due to large breaks in the API without the introduction of
a stable replacement. Pull Requests to re-enable these data connectors
are welcome.
github上说打补丁什么的,还有改代码之类的,也有说有pandas_datareader分支有已经修复的包。
后来还是根据说安装pandas_datareader的dev包来解决
不过GitHub的写法是
pip install git+https://github.com/pydata/pandas-datareader.git
注意 这都是anaconda管理的,但不能直接通过conda直接安装dev包
不过我么有装git啊 那么操作如下
- 先运行Anaconda Prompt就是Anaconda中打开的那个terminal,不过在win下开始菜单可以直接用Anaconda Prompt打开。
- 安装dev包之前需要卸载已经安装的pandas-datareader包
pip uninstall pandas-datareader
- 下载zip包 解压 切换到解压后的目录
- 然后通过pip安装dev包
pip setup.py install
pdr.get_data_yahoo('APPL')获取不到苹果的股票数据 好像是接口问题 舍弃苹果的数据
调用函数sns.distplot()有个警告
C:UsersweimoAnaconda3libsite-packagesmatplotlibaxes_axes.py:6462: UserWarning: The 'normed' > kwarg is deprecated, and has been replaced by the 'density' kwarg.
warnings.warn("The 'normed' kwarg is deprecated, and has been "
GitHub上有评论说是版本变化引出的问题,但似乎又没有影响,搜索到一个中文博客是说直接修改源代码
seaborn/distributions.py
hist_kws.setdefault(“normed”, norm_hist)
改为
hist_kws.setdefault(“density”, norm_hist)
不过最终决定暂时不管,毕竟只是个warning。
推测应该是数据源的问题
总结:就像是在学matlab画图...但课程中提到Matplotlib for Python Developers这本书,目前出第二版了(2018)。第一版还是2009年,计划好好学学。顺便翻译一下?
这本书的彩图PDF官方链接:
https://www.packtpub.com/sites/default/files/downloads/MatplotlibforPythonDevelopersSecondEdition_ColorImages.pdf
GitHub上的章节代码:
https://github.com/PacktPublishing/Matplotlib-for-Python-Developers-Second-Edition/
书籍首页:
记录正文
import numpy as np
import pandas as pd
pd.core.common.is_list_like = pd.api.types.is_list_like
from pandas import Series, DataFrame
import pandas_datareader as pdr

import matplotlib.pyplot as plt
import seaborn as sns
%matplotlib inline

from datetime import datetime
start = datetime(2014, 9, 20)
alibaba = pdr.get_data_yahoo('BABA', start=start)
amazon = pdr.get_data_yahoo('AMZN', start=start)alibaba.head()| High | Low | Open | Close | Volume | Adj Close | |
|---|---|---|---|---|---|---|
| Date | ||||||
| 2014-09-19 | 99.699997 | 89.949997 | 92.699997 | 93.889999 | 271879400 | 93.889999 |
| 2014-09-22 | 92.949997 | 89.500000 | 92.699997 | 89.889999 | 66657800 | 89.889999 |
| 2014-09-23 | 90.480003 | 86.620003 | 88.940002 | 87.169998 | 39009800 | 87.169998 |
| 2014-09-24 | 90.570000 | 87.220001 | 88.470001 | 90.570000 | 32088000 | 90.570000 |
| 2014-09-25 | 91.500000 | 88.500000 | 91.089996 | 88.919998 | 28598000 | 88.919998 |
amazon.head()| High | Low | Open | Close | Volume | Adj Close | |
|---|---|---|---|---|---|---|
| Date | ||||||
| 2014-09-19 | 332.760010 | 325.570007 | 327.600006 | 331.320007 | 6886200 | 331.320007 |
| 2014-09-22 | 329.489990 | 321.059998 | 328.489990 | 324.500000 | 3109700 | 324.500000 |
| 2014-09-23 | 327.600006 | 321.250000 | 322.459991 | 323.630005 | 2352600 | 323.630005 |
| 2014-09-24 | 329.440002 | 319.559998 | 324.170013 | 328.209991 | 2642200 | 328.209991 |
| 2014-09-25 | 328.540009 | 321.399994 | 327.989990 | 321.929993 | 2928800 | 321.929993 |
#alibaba.shape
#alibaba.describe()
alibaba.to_csv("alibaba.csv")
amazon.to_csv("amazon.csv")
alibaba['Adj Close'].plot(legend=True)<matplotlib.axes._subplots.AxesSubplot at 0x2eb3813a128>
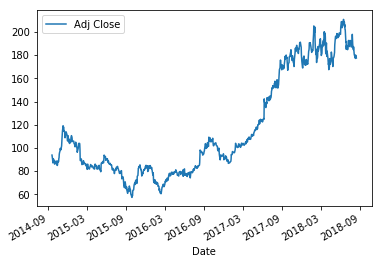
for _ in alibaba:
    if _ == 'Volume':
        continue
    alibaba[_].plot(legend=True)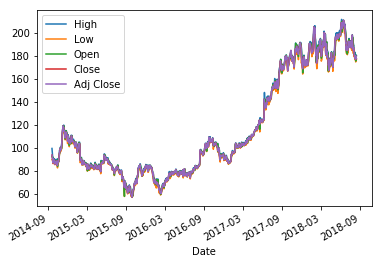
alibaba['high-low'] = alibaba['High'] - alibaba['Low']alibaba.head()| High | Low | Open | Close | Volume | Adj Close | high-low | |
|---|---|---|---|---|---|---|---|
| Date | |||||||
| 2014-09-19 | 99.699997 | 89.949997 | 92.699997 | 93.889999 | 271879400 | 93.889999 | 9.750000 |
| 2014-09-22 | 92.949997 | 89.500000 | 92.699997 | 89.889999 | 66657800 | 89.889999 | 3.449997 |
| 2014-09-23 | 90.480003 | 86.620003 | 88.940002 | 87.169998 | 39009800 | 87.169998 | 3.860001 |
| 2014-09-24 | 90.570000 | 87.220001 | 88.470001 | 90.570000 | 32088000 | 90.570000 | 3.349998 |
| 2014-09-25 | 91.500000 | 88.500000 | 91.089996 | 88.919998 | 28598000 | 88.919998 | 3.000000 |
alibaba['high-low'].plot(figsize=(25,5))<matplotlib.axes._subplots.AxesSubplot at 0x2eb388cd6d8>

alibaba['daily-return'] = alibaba['Adj Close'].pct_change()alibaba['daily-return'].plot(figsize=(25,5),linestyle='--',marker='o')<matplotlib.axes._subplots.AxesSubplot at 0x2eb38b609b0>

sns.distplot(alibaba['daily-return'].dropna(),bins=100,color='red')C:\Users\weimo\Anaconda3\lib\site-packages\matplotlib\axes\_axes.py:6462: UserWarning: The 'normed' kwarg is deprecated, and has been replaced by the 'density' kwarg.
warnings.warn("The 'normed' kwarg is deprecated, and has been "
<matplotlib.axes._subplots.AxesSubplot at 0x2eb3a9bfac8>
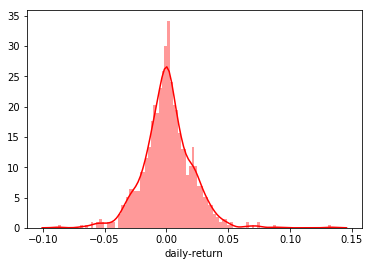
start = datetime(2015, 1, 1)
company = ['GOOG', 'MSFT', 'AMZN', 'FB']
#company = 'APPL'
top_tech_df = pdr.get_data_yahoo(company,start=start)['Adj Close']top_tech_df.head()| Symbols | AMZN | FB | GOOG | MSFT |
|---|---|---|---|---|
| Date | ||||
| 2014-12-31 | 310.350006 | 78.019997 | 523.521423 | 42.663837 |
| 2015-01-02 | 308.519989 | 78.449997 | 521.937744 | 42.948578 |
| 2015-01-05 | 302.190002 | 77.190002 | 511.057617 | 42.553627 |
| 2015-01-06 | 295.290009 | 76.150002 | 499.212799 | 41.929050 |
| 2015-01-07 | 298.420013 | 76.150002 | 498.357513 | 42.461777 |
top_tech_df.plot()<matplotlib.axes._subplots.AxesSubplot at 0x180d6e03f60>
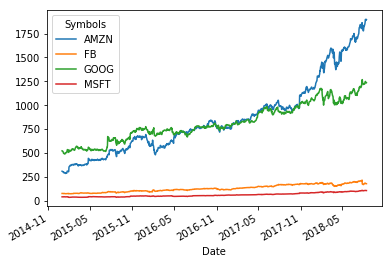
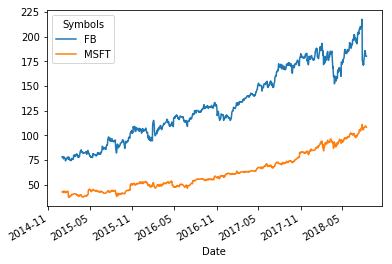
top_tech_dr = top_tech_df.pct_change()top_tech_df[['FB', 'MSFT']].plot()<matplotlib.axes._subplots.AxesSubplot at 0x180d6de7550>
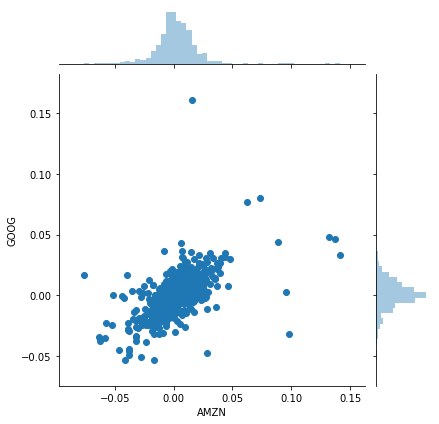
sns.jointplot('AMZN','GOOG',top_tech_dr,kind='scatter')<seaborn.axisgrid.JointGrid at 0x180d6859f98>
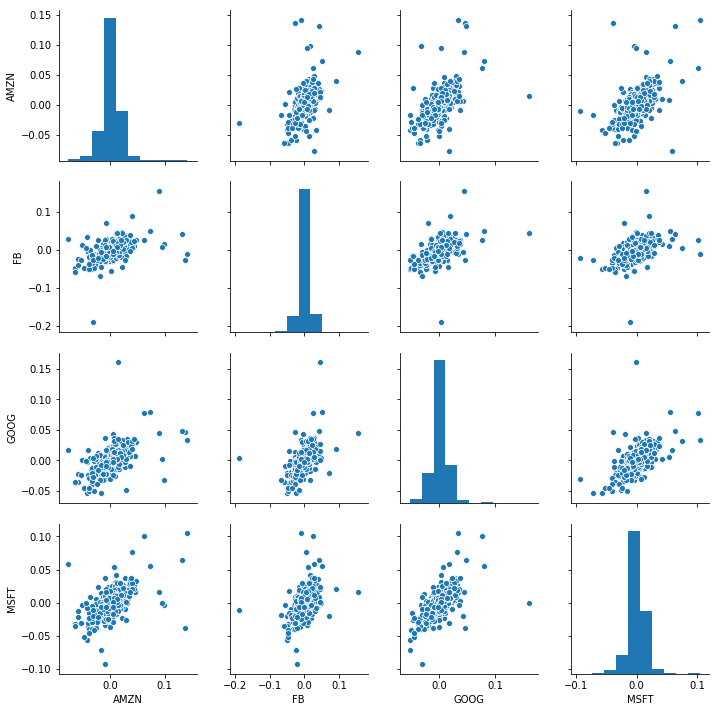
sns.pairplot(top_tech_dr.dropna())<seaborn.axisgrid.PairGrid at 0x180d6db60f0>
top_tech_dr['MSFT'].quantile(0.02)-0.029942679770481886

